Humans Still Beat AI in the Long Horizon: Revisiting Test-Time Scaling in the Agent Era
1 UC Berkeley · 2 University of Washington · 3 Princeton University · 4 Bespoke Labs
TL;DR. Agents can spend test-time compute by trying, observing, and revising, so we ask whether their gains come from a better internal strategy or from something close to repeated sampling. We derive a simple Elo reference line: repeated sampling is linear in log test-time compute. In a 2022 two-week coding marathon, current agents plateau within 24 hours, while top humans keep improving over the official two weeks. The takeaway is that humans still do much better long-horizon test-time adaptation, and agent strategies have a lot of room to improve.
Agents Bring Intrinsic Test-Time Strategies
OpenAI’s o1 report showed that more test-time compute can improve model performance. Many papers followed, especially on verifiable tasks like code and math (Snell et al., Large Language Monkeys, Noam Brown’s recent post). The common plot is success rate versus the log number of trials, or log test-time compute. These curves often rise superlinearly before they saturate.
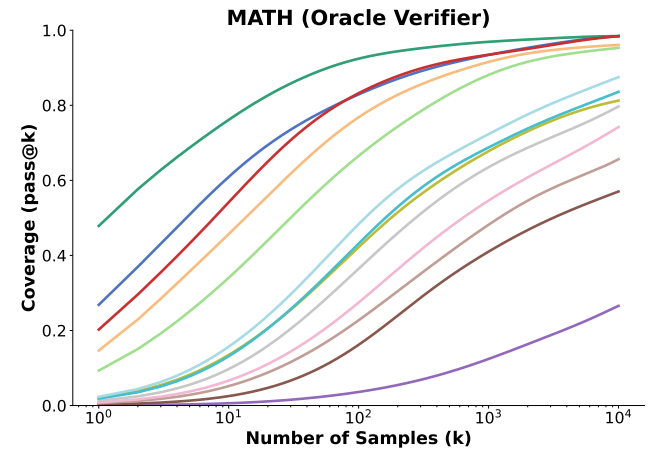
Coverage on MATH with an oracle verifier as the number of samples increases, from Large Language Monkeys.
These studies measure model performance under an external test-time strategy. The strategy is fixed outside the model: sample many candidate solutions, check them with a verifier, and report pass@k or coverage.
However, agents change this setup. During a run, an agent can try a solution, observe the result, reflect on what failed, and revise its next attempt. This raises the question we study: when an agent improves with more test-time compute, is it using a better test-time strategy, or is it mostly reproducing repeated sampling?
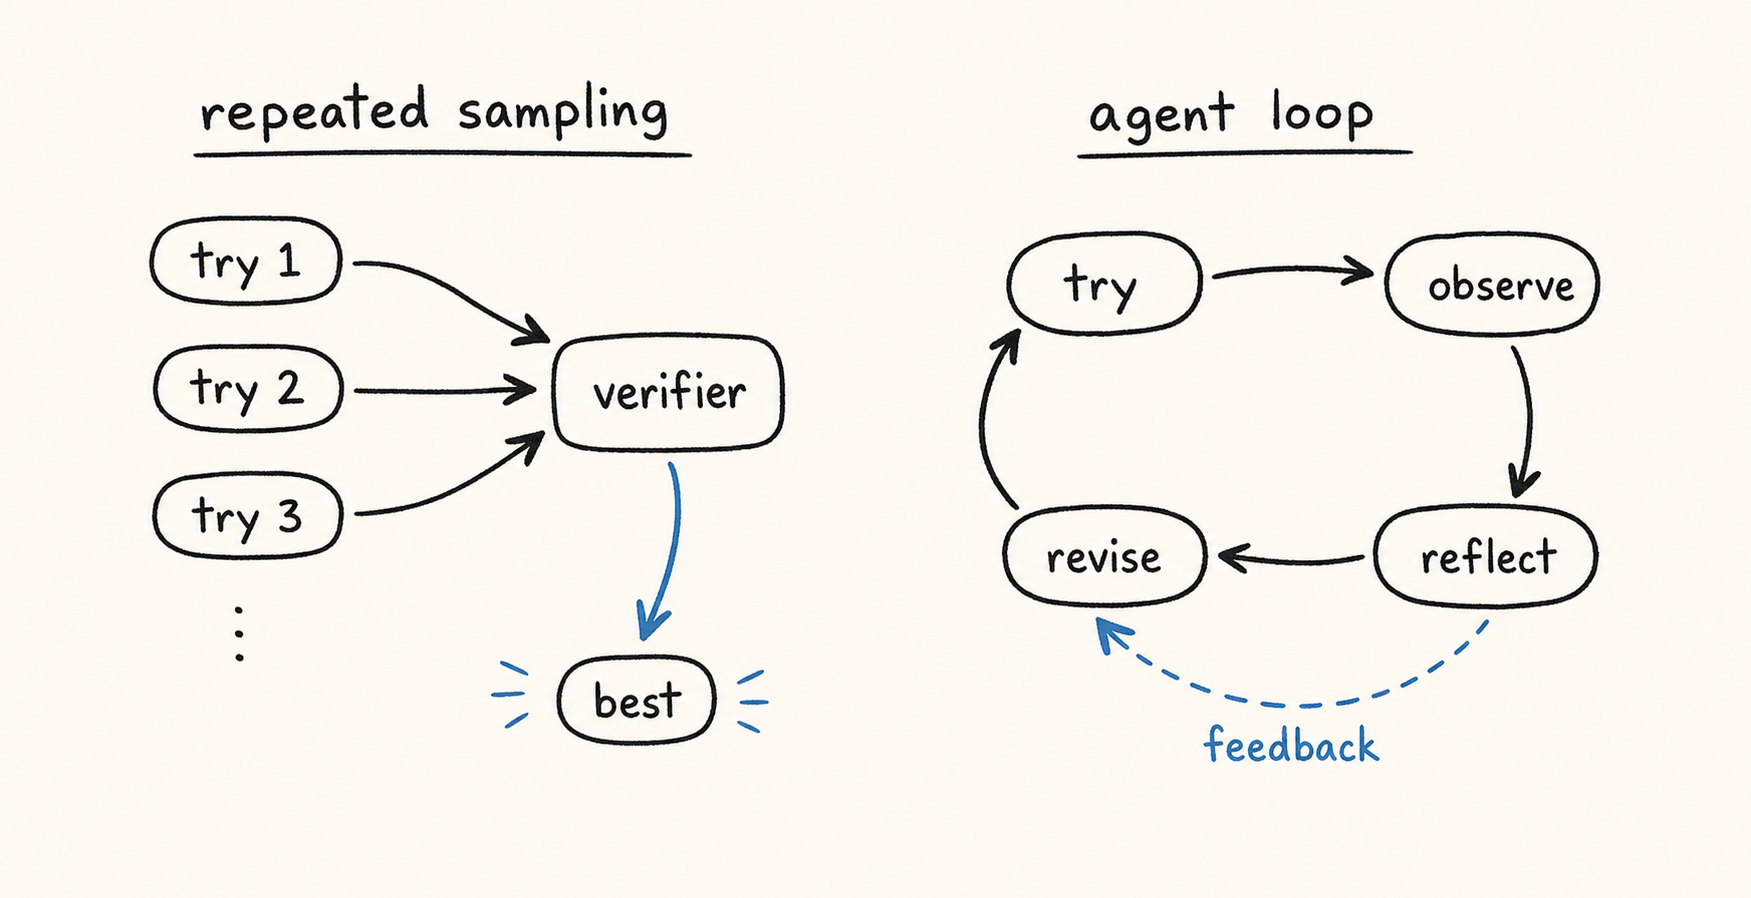
Repeated sampling is fixed outside the model, while an agent can use feedback inside the run.
A Simple Model for Test-Time Scaling
We first write down the simplest model behind the usual pass@k curves: repeated sampling. The model treats each attempt as an independent draw from the same continuous score distribution. For one task, let \(X\) be the score of one sample and let \(\tau\) be the threshold for success. Then one sample succeeds with probability
\[p = \operatorname{Pr}(X \geq \tau).\]With \(k\) independent samples, pass@k is
\[\operatorname{Pr}\left(\max_{1 \leq i \leq k} X_i \geq \tau\right) = 1 - (1 - p)^k.\]For a dataset with multiple tasks, the usual test-time scaling curve averages this quantity across tasks. This gives a curve of mean pass@k, or coverage, as a function of the number of samples.
However, this evaluation is awkward for agents. An agent usually stops once it solves the task, so it is not natural to keep asking for more independent samples after success. For open-ended tasks such as FrontierCS, we could instead compare runs by the task’s own score. But raw-score gains are hard to interpret. In circle-packing tasks studied by AlphaEvolve, improving the objective value from 1 to 2 can be trivial, while improving it from 2.35 to 2.36 can require a much harder improvement. The score number does not by itself tell us how much capability changed. We therefore want a comparison that asks a simpler question: when one candidate spends more test-time compute than another candidate on the same task, how often does it produce the better answer?
Following the same repeated-sampling model, this becomes a pairwise question. If one candidate gets \(k_a\) independent attempts and another gets \(k_b\) independent attempts, the pairwise win probability is
\[\operatorname{Pr}\left(\max_{1 \leq i \leq k_a} X_i > \max_{1 \leq j \leq k_b} X'_j\right) = \frac{k_a}{k_a + k_b},\]where \(X_i\) and \(X'_j\) are independent attempts on the same task.
Now comes the useful part. A Bradley-Terry model converts pairwise win rates into a one-dimensional strength scale. If candidate \(a\) has BT log-strength \(\theta_a\) and candidate \(b\) has BT log-strength \(\theta_b\), then
\[\operatorname{Pr}(a \text{ beats } b) = \frac{\exp(\theta_a)}{\exp(\theta_a) + \exp(\theta_b)}.\]We can see that, for repeated sampling, the pairwise win probability above is exactly matched by
\[\theta_a = \log k_a + c,\]for any constant \(c\).
Thus, repeated sampling is a test-time strategy whose Elo is linear in log test-time compute. This is super helpful because it gives us a reference line. To judge an agent’s intrinsic test-time strategy, we can plot its Elo curve as test-time compute increases and compare it to this line. If the curve is above, below, or close to linear, the agent’s strategy is better than, worse than, or equivalent to repeated sampling.
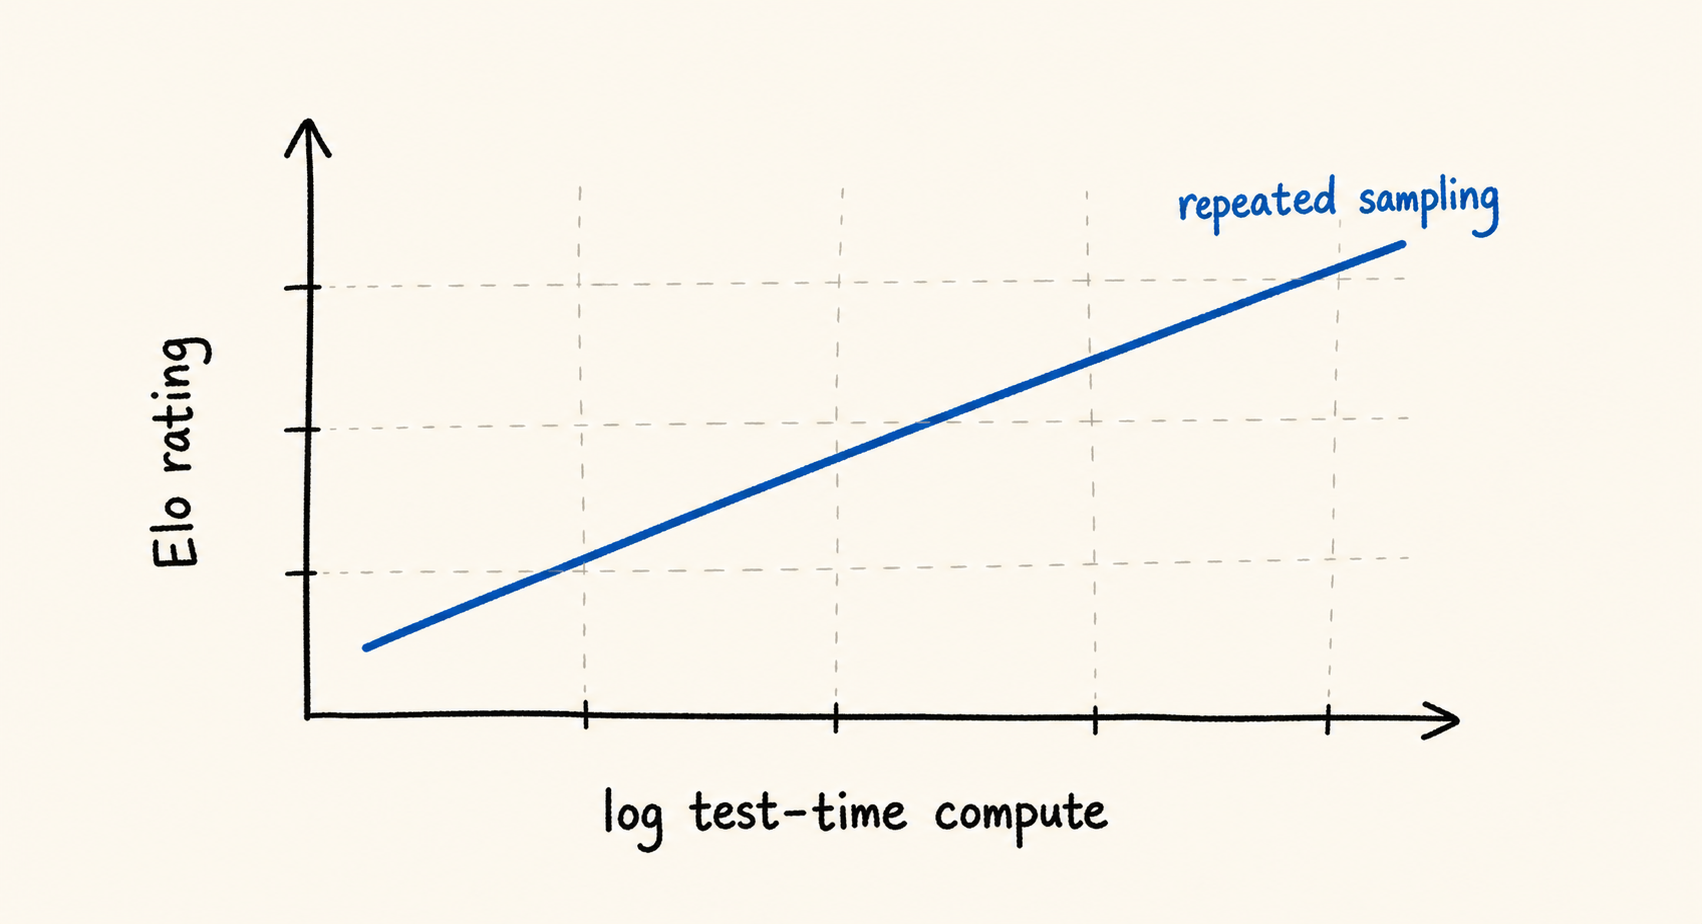
Repeated sampling gives a linear reference line in Elo versus log test-time compute.
Agents Struggle, Humans Do More Than Sample
With this reference line in hand, we can ask what happens in real long-horizon tasks. We compare agent trajectories against the repeated-sampling line, and we also ask: how do they compare to top humans working on the same tasks?
We study AtCoder Heuristic Contest 014: RectJoin, a long-horizon coding and optimization contest in 2022. Human contestants write algorithms and can submit many code solutions during the contest, and the leaderboard keeps the best score they achieve. Since the contest happened before modern coding agents were widely available, these human trajectories are not assisted by AI agents. The task is open-ended: there is no known optimal solution, only better and worse scores.
At a high level, RectJoin starts with marked dots on a grid. A solver repeatedly chooses three existing dots and one empty grid point that form a valid axis-aligned or 45-degree rectangle, then marks the new point and draws the rectangle boundary. The objective is to maximize a weighted score over the final marked dots, where dots farther from the center have larger weight.
Visualization of RectJoin from AtCoder Heuristic Contest 014.
Methodology
Human trajectories. For humans, we study two groups from the final standings: the top 10 contestants and the top 50 contestants. At each checkpoint, we compute prefix-best scores. This gives one vector for each human group at each checkpoint, where each entry is a contestant’s best score up to that time.
Agent setting. We recreate the contest setting for agents. Using the FrontierCS evaluation layer, each agent runs in a continuous 24-hour loop. It can keep submitting candidates, observe scores, and revise its next attempt, just like a human contestant. If it stops early, we resume the same session rather than starting a fresh run.
We test two agent systems: Claude Opus 4.6 with Claude Code, and GPT-5.5 with Codex. For each agent system, we run five independent 24-hour trials. At every wall-clock checkpoint we care about, we collect the prefix-best score from each trial. This gives a length-5 vector for each agent system at each checkpoint.
Once we have these vectors, we can estimate pairwise win rates directly. For example, one vector might contain the prefix-best scores of the top 10 human contestants at 24 hours, while another contains the prefix-best scores from the five Claude Code trials at 5 hours. We want to know how often the 24-hour top-human scores beat the 5-hour Claude Code scores. If the two vectors are
\[u = (u_1, \ldots, u_n), \qquad v = (v_1, \ldots, v_m),\]we define the empirical probability that \(u\) beats \(v\) by comparing all pairs:
\[\widehat{\operatorname{Pr}}(u \text{ beats } v) = \frac{1}{nm}\sum_{i=1}^{n}\sum_{j=1}^{m} \mathbf{1}[u_i > v_j].\]These pairwise win rates are the inputs to the Elo fit.
Results
We fit Elo ratings from these pairwise win rates using L-BFGS. All agent systems and human groups are placed in one joint Bradley-Terry fit, so their ratings are directly comparable. For agents, we use the 24-hour trajectories from our runs. For humans, we use the full trajectories from the official two weeks.
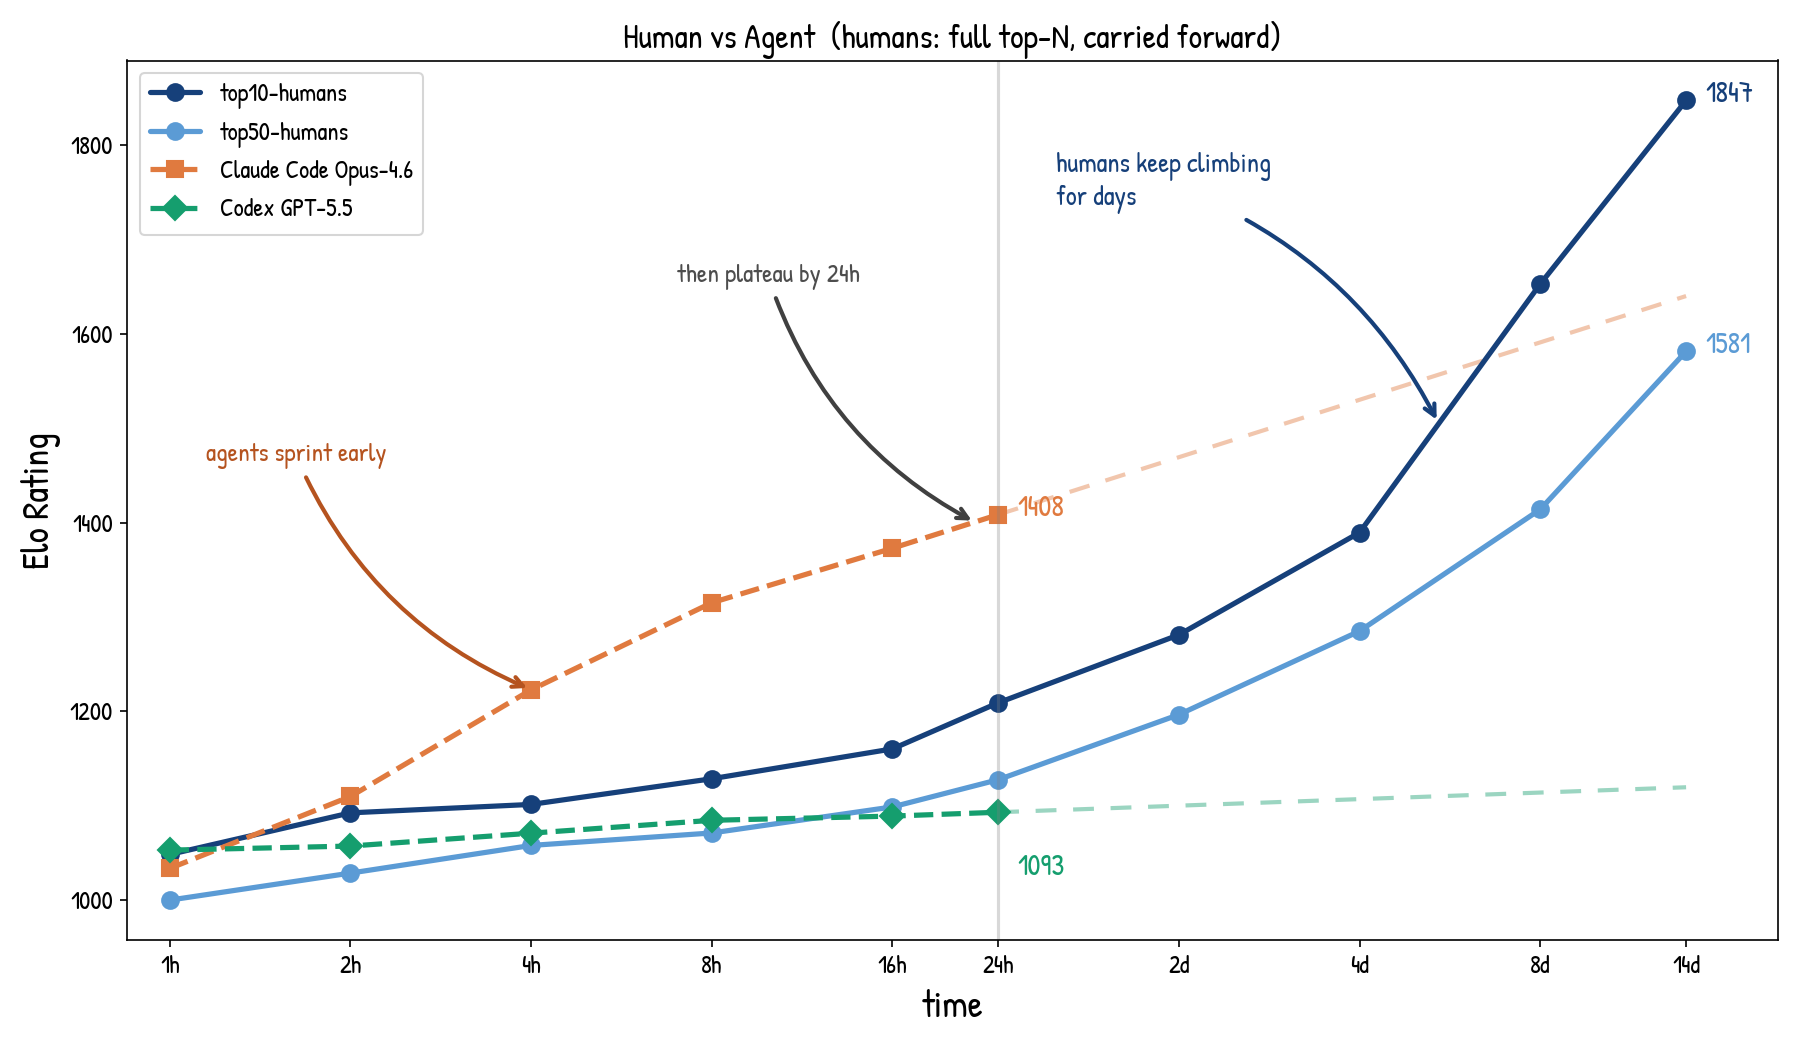
Elo trajectories for top humans and agent systems on RectJoin, the long-horizon coding task introduced above.
The result is sharp. Agents improve quickly in the first few hours, but their Elo curves flatten by the 24-hour mark, even though a single agent trial can use up to 100M tokens. Top humans improve more slowly at first, but they keep climbing for days and eventually pass the agent systems by a large margin. This suggests that current agents can sprint early, but they still lack the long-horizon test-time adaptation that strong human contestants use during an extended contest.
We can also ask a more local question for each participant system. If we only look at one system at a time, the repeated-sampling model gives a reference line for what would happen if that system simply drew more independent samples from its own output distribution. Comparing the observed Elo curve against this line tells us whether the system’s test-time strategy is more or less efficient than repeated sampling from itself.
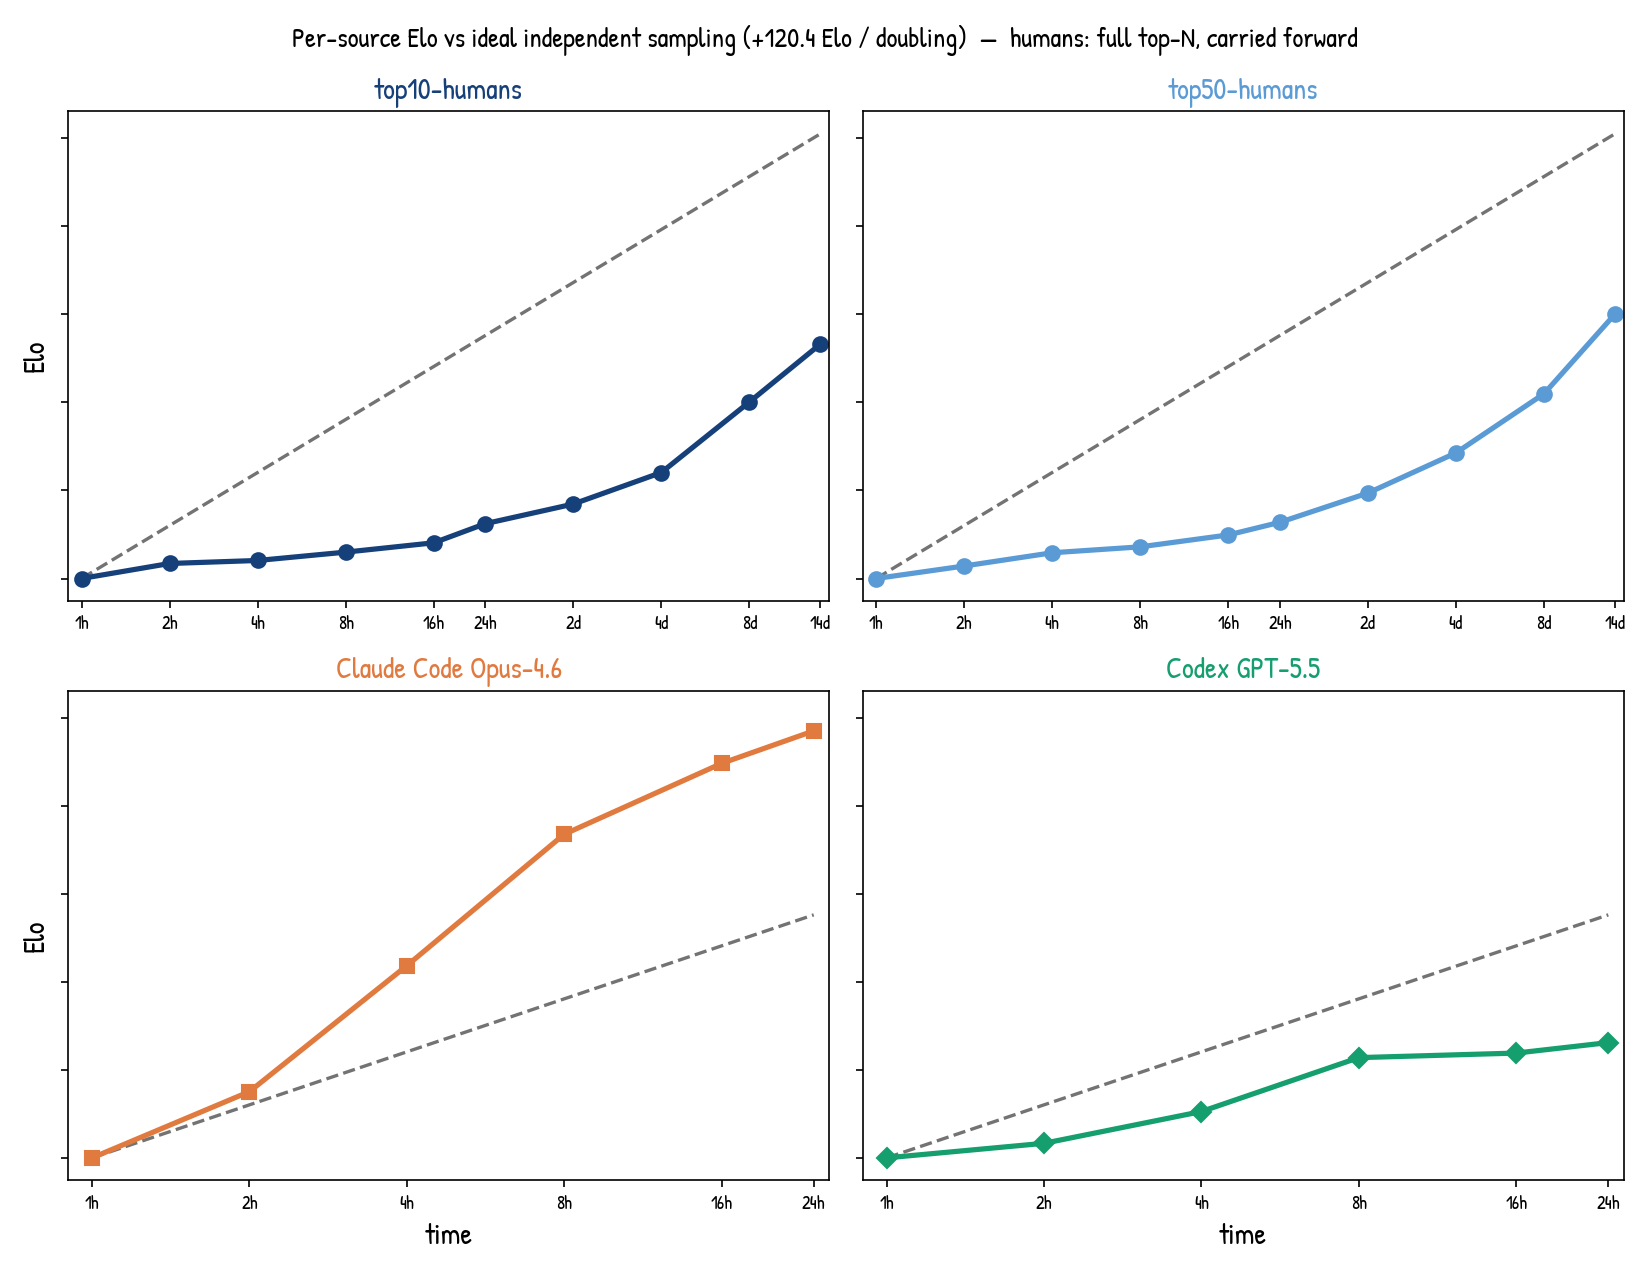
Per-source Elo curves compared with the repeated-sampling reference line implied by the model.
The gray dashed line is the repeated-sampling reference. Curves above this line gain Elo faster than independent sampling from the same source distribution. Curves below it gain Elo more slowly. The agent systems become sublinear relative to this reference by the end of the 24-hour run. In contrast, the human curves become superlinear over longer horizons. Humans do not just sample; current agents still have a long way to go on long-horizon test-time scaling.
Takeaways for Agentic Test-Time Scaling
- Agents have their own test-time strategies. We should evaluate whether performance improves with more compute and what strategy produced that improvement.
- Use repeated sampling as a reference line. If an agent's Elo grows linearly with log compute, it may be doing little more than repeated sampling. Deviations from that line are the signal.
- Keep humans as a long-horizon reference. Top humans still show adaptive improvement over long horizons, which gives us a useful target for agentic test-time scaling.
- Study more open-ended long-horizon tasks. We need more tasks, longer run trajectories, and careful failure analysis to understand where agents still fall short.
Citing Us
Our full paper is coming soon. In the meantime, please cite this blog post if you found it helpful. For discussion, contact qmang@berkeley.edu or lky04@cs.washington.edu.
@misc{mang2026humansstillbeatagents,
  title  = {Humans Still Beat AI in the Long Horizon: Revisiting Test-Time Scaling in the Agent Era},
  author = {Qiuyang Mang and Kaiyuan Liu and Bo Peng and Shreyas Pimpalgaonkar and Luke Zettlemoyer and Alex Dimakis and Alvin Cheung},
  year   = {2026},
  url    = {https://joyemang33.github.io/blog/2026/humans-dont-just-sample/}
}